Cutler Commentary
First Quarter 2026 Market Outlook
April 07, 2026
First Quarter 2026 Market Outlook
Liberation Day was a year ago on April 2nd, 2025. At the time, this seemed as if it would be the most economically impactful policy decision of the current administration. However, policy adjusted, as did the markets, and the indexes found their footing and marched higher throughout 2025. As 2026 began, “more of the same” seemed to be the expectation. Yet, even before Operation Epic Fury, a market rotation was underway. The impact of Artificial Intelligence was being felt, with software stocks significantly down (Claude Code has shown to greatly reduce barriers to entry for this industry) and dividend stocks (often companies that make “stuff” are harder to replace with AI) rallying.
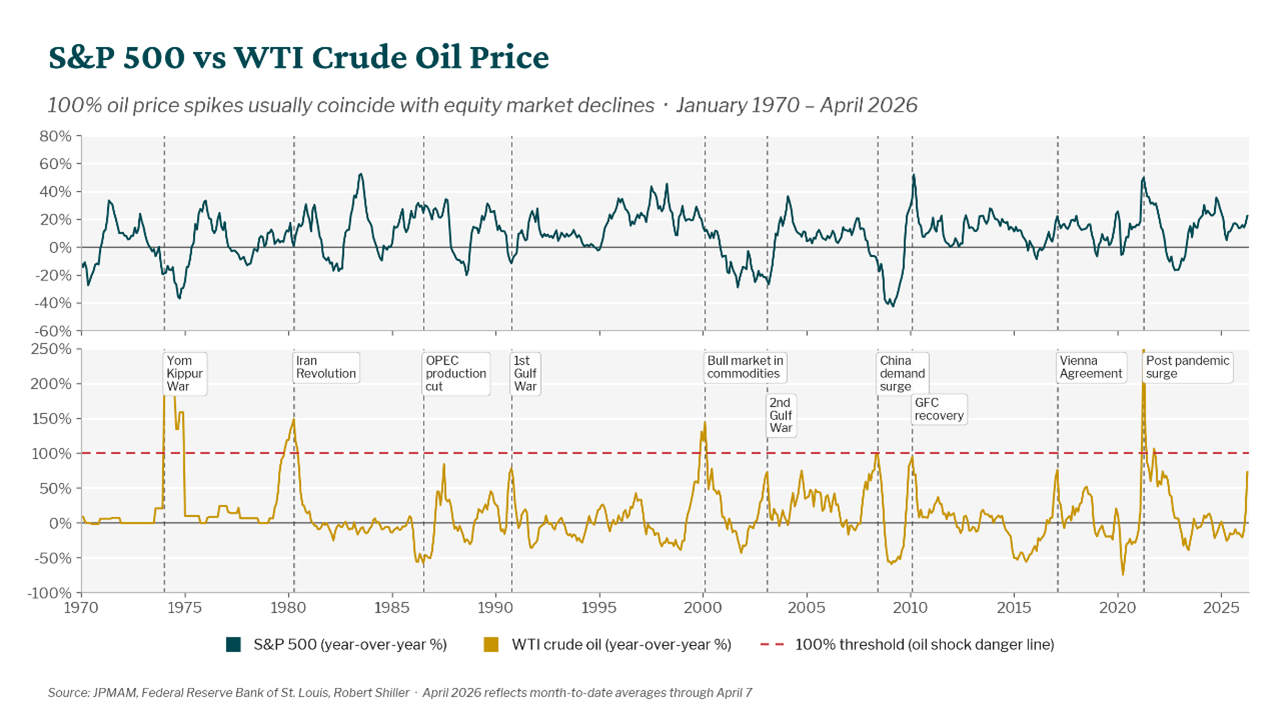
Then, on February 28th, everything changed. Coordinated U.S.-Israeli strikes on Iran launched Operation Epic Fury. Iran retaliated, and by March 4th the Strait of Hormuz, through which roughly 20% of the world's seaborne oil flows, was effectively closed. Oil surged from $58, peaked near $120, and has been resting comfortably above $100. The IEA called it the largest supply disruption in the history of the global oil market. The nearby chart shows the historical correlation of similar oil price spikes. An increase of 100% in the price of oil almost always means a market sell-off, and as expected the S&P 500 finished the quarter down approximately 6%. The Nasdaq entered correction territory (10% from its highs), and the Magnificent Seven lost an estimated $2 trillion in market cap – roughly the total market cap of South Korea. Not exactly the start to the year anyone had hoped for.
Yet, despite all of the geopolitical news, there are reasons for investors to remain optimistic.
- Earnings growth remains strong. History is remarkably clear on this point- oil shocks have ended business cycles when earnings growth was already declining or negative. Consider 2008, when financial sector earnings were collapsing before oil hit $140. Today, S&P 500 earnings growth is running at 14%, with forward estimates above 20%. That is not a recession setup. It is a market absorbing a shock while the underlying engine continues to run.
- Volatility is within normal ranges. The average annual drawdown for the S&P 500 is 13.5%. In midterm election years such as 2026, the average pullback is 18%. The S&P finished the first quarter down roughly 6%. It is also worth noting that last year the S&P 500 returned nearly 18%, but the median stock returned only about 3%. This is due to increased concentration. With the recent weakness in the Magnificent 7 stocks, weak index returns are not unexpected, but we are seeing a broadening of market participation. Through 3/31/26, the equal weight S&P index was flat, while the market cap weighted version of this index down 6% in Q1. By most measures, the stock market is not falling apart; it is rebalancing.
- Artificial Intelligence. We are at the beginning stages of the implementation phase of AI. For the past several years, the building blocks of AI have been the predominant investment theme. Companies like NVIDIA and the rest of the Magnificent 7 helped propel stocks higher and even avoid recession while economic indicators (such as the yield curve and the Leading Indicators Index) suggested a recession was likely. We believe that this next phase will lead to market gains across sectors, as companies improve productivity and accelerate innovation. This is an exciting time to be an investor.While these are sound reasons to remain positive on the equity markets, one cannot ignore the news. As of this writing, there is no clear off-ramp for the Iran War. The ability to open the Strait of Hormuz seems to be contingent on ending hostilities, and negotiations do not seem to be progressing. Gas prices have skyrocketed, and consumers are feeling it at the pump. Our economy is about 2/3 consumer based, and GDP expectations have come down from 2.8% to roughly 2.4%. Notably, this is slower growth, not negative growth. Oil shocks, however, are historically self-correcting. Higher prices reduce consumer demand for oil, but they also exert enormous political pressure which will likely lead to a resolution of hostilities at some point. With a return of geopolitical stability the more likely medium-term outcome, we believe investors who remain invested will be glad they did.
The S&P 500 Index is widely regarded as the best single gauge of large-cap U.S. equities. The index includes 500 leading companies and captures approximately 80% coverage of available market capitalization. The Barclay’s Aggregate Bond Index (Taxable Bond) is a broad base, market capitalization weighted bond market index representing intermediate term investment grade bonds traded in the United States. The US Large Value Index measures the performance of US large-cap stocks with relatively low prices given anticipated per-share earnings, book value, cash flow, sales and dividends. This Index does not incorporate Environmental, Social, or Governance (ESG) criteria. The US Large Growth Index measures the performance of US large-cap stocks that are expected to grow at a faster pace than the rest of the market as measured by forward earnings, historical earnings, book value, cash flow and sales. This Index does not incorporate Environmental, Social, or Governance (ESG) criteria..
All opinions and data included in this commentary are as of March 31, 2026 and are subject to change. The opinions and views expressed herein are of Cutler Investment Counsel, LLC and are not intended to be a forecast of future events, a guarantee of future results or investment advice. This report is provided for informational purposes only and should not be considered a recommendation or solicitation to purchase securities. This information should not be used as the sole basis to make any investment decision. The statistics have been obtained from sources believed to be reliable, but the accuracy and completeness of this information cannot be guaranteed. Neither Cutler Investment Counsel, LLC nor its information providers are responsible for any damages or losses arising from any use of this information.
CATEGORIES


Disclaimer
These blogs are provided for informational purposes only and represent Cutler Investment Group’s (“Cutler”) views as of the date of posting. Such views are subject to change at any point without notice. The information in the blogs should not be considered investment advice or a recommendation to buy or sell any types of securities. Some of the information provided has been obtained from third party sources believed to be reliable but such information is not guaranteed. Cutler has not taken into account the investment objectives, financial situation or particular needs of any individual investor. There is a risk of loss from an investment in securities, including the risk of loss of principal. Different types of investments involve varying degrees of risk, and there can be no assurance that any specific investment will be profitable or suitable for a particular investor's financial situation or risk tolerance. Any forward looking statements or forecasts are based on assumptions and actual results are expected to vary. No reliance should be placed on, and no guarantee should be assumed from, any such statements or forecasts when making any investment decision.